PMO With Claude and MCP Server: How to Upgrade the Conversation in the Steering Committee
Four committee questions every PMO dreads — answered with grounded, reproducible numbers instead of vibes. A practical walkthrough of pmo.run's MCP server with Claude, code blocks included.
Every steering committee runs on four questions: how long, how risky, which option, are we on track?
In most programmes the answers are vibes. At best, a senior person’s intuition elegantly dressed up in a slide. At worst, work rushed out just to get through the meeting.
Claude with an MCP server changes the mechanics of that conversation. Claude does the listening, the asking, and the explaining; the pmo.run MCP server does the maths — the same maths, the same way, every time, with an audit trail. This post shows the four conversations, each with the exact tool call and its real output.
For a running example we will use a deliberately fictional programme: a 12-month project bolting an AI-driven BI layer onto a bespoke, API-less legacy core system, with a team of about ten. Every number below is a worked illustration, not client data — but the patterns will feel familiar.
The Two-Minute Setup
The server is on PyPI; uvx runs it without installing anything:
claude mcp add pmo-logic -- uvx pmorun-mcpThat is the whole setup for Claude Code. (Claude Desktop takes the same uvx pmorun-mcp command in its MCP config — full details in the technical docs.) Everything runs locally; no data leaves your machine, and there is no sign-up.
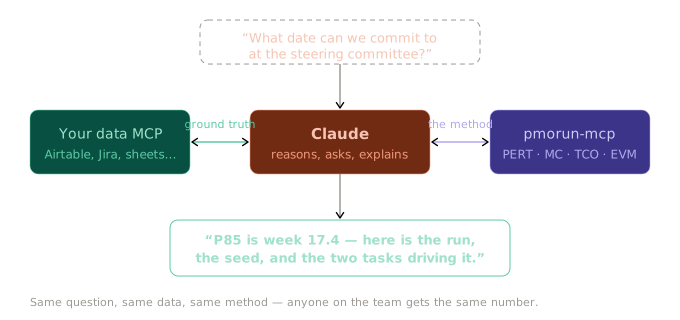
The composition is the point. Claude on its own will happily write you the code — but it arrives alongside the chat, unscrutinised. Either you pay to review it every time, or you skip the review, paste the answer into your deck, and risk deciding on something wrong. Add your data MCP (Airtable, Jira, a spreadsheet) and Claude can see your project from its real records. Add pmorun-mcp and it can compute on what it sees — with a method your whole team shares. That is no longer a tool; it is shared knowledge:
Conversation 1: “How Long Will the Investigation Take?”
You ask Claude, in plain language:
Estimate the legacy-system investigation phase. The team says optimistic 4 weeks, most likely 6, pessimistic 8 — but communication is fragmented across three vendors and the documentation is stale.
Claude calls estimate_task_duration with the insight tags, and gets back:
{
  "textbook": { "expected": 6.0, "std_dev": 0.67, "range_95": [4.67, 7.33] },
  "adjusted": {
    "expected": 7.72, "std_dev": 2.39, "range_95": [2.95, 12.5],
    "pessimistic": 18.33,
    "tags_applied": [
      { "name": "FRAGMENTED_COMMUNICATION", "severity": 0.7, "multiplier": 1.38 },
      { "name": "MULTIPLE_STAKEHOLDERS",   "severity": 0.6, "multiplier": 1.66 }
    ]
  }
}
Before: “The team says six weeks.” After: “Six weeks is the textbook number. Adjusted for the communication friction we have already named, expect closer to eight, and the credible worst case is twelve — here are the two factors driving it.” Investigation phases under exactly these conditions commonly run 1.5–2× the planned estimate; now the committee can see why, as named multipliers rather than a mysterious overrun.
Conversation 2: “What Date Can We Commit To?”
The Gantt chart adds most-likely durations along the longest path and announces 13 weeks. You ask Claude:
Simulate the schedule: investigation (4/6/12), then connector implementation (2/4/10) and data cleansing (3/4/9) in parallel, then BI integration (2/3/6) after both.
Claude calls identify_schedule_risk — a 10,000-run Monte Carlo simulation over the dependency graph:
{
  "n_simulations": 10000,
  "percentiles": { "P50": 15.26, "P75": 16.66, "P85": 17.42, "P95": 18.68 },
  "critical_path_frequency": {
    "investigation": 1.0,
    "connector_implementation": 0.48,
    "data_cleansing": 0.52,
    "bi_integration": 1.0
  }
}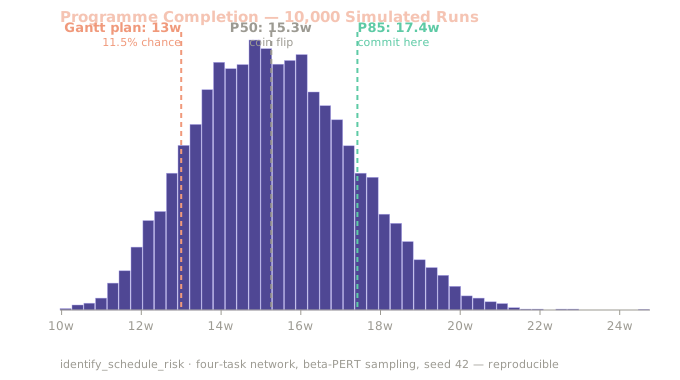
Before: “The plan says week 13.” After: “Week 13 happens in roughly one run in nine. If the committee wants a date we keep 85 times out of 100, commit to week 17.4 — and note that data cleansing sits on the critical path slightly more often than the connector everyone is worried about.” Same inputs, same seed, same answer next week when someone challenges it.
Conversation 3: “Employee or Contractor for the Integration Seat?”
The classic staffing question, argued monthly on sticker price. You ask Claude to compare a permanent hire against a contractor for a three-year horizon (figures in neutral cost units — substitute your own rate card):
{
  "results": [
    { "name": "employee_seat",   "monthly_cost": 10.0,  "total_cost": 360.0, "npv_tco": 340.79, "rank": 1 },
    { "name": "contractor_seat", "monthly_cost": 12.92, "total_cost": 465.0, "npv_tco": 438.61, "rank": 2 }
  ],
  "best_option": "employee_seat"
}
compare_investment_options folds in what the monthly sticker hides: recruitment and ramp-up on one side, the absence of long-term liability on the other, and NPV discounting on both. Before: “The contractor’s day rate is higher, obviously.” After: “Over three years the gap is 1.3×, not the 1.6× the monthly rates suggest — and the model makes the real trade explicit: the employee seat is cheaper and the knowledge stays; the contractor seat buys flexibility at a priced premium.” The committee debates assumptions, not arithmetic.
Conversation 4: “Are We Actually on Track?”
Month six. The status report says amber. You give Claude four numbers — planned value 120, earned value 96, actual cost 126, budget 240 — pulled straight from your tracking MCP, and it calls evaluate_project_health:
{
  "metrics": {
    "spi": 0.8, "cpi": 0.7619,
    "eac": 315.0, "vac": -75.0, "tcpi": 1.2632,
    "percent_complete": 40.0, "percent_spent": 52.5
  },
  "health": {
    "status": "off_track",
    "reasons": ["Schedule: SPI 0.8 < 0.9 threshold", "Cost: CPI 0.7619 < 0.9 threshold"],
    "summary": "Project off track — immediate attention required."
  }
}
Before: “We feel a bit behind, but the team is confident.” After: “We have done 40% of the work and spent 52.5% of the money. At this efficiency the forecast at completion is 315 against a budget of 240, and recovering within budget requires a cost performance of 1.26 — which we have never achieved. The data-cleansing overrun is not a blip; it is the trend.” Amber becomes a decision, not a mood.
“But ChatGPT Can Do This Maths”
It can — once, by hand, differently every time, with no audit trail. Ask a general LLM to improvise a Monte Carlo simulation and you get plausible Python and a plausible answer; ask again tomorrow and you get a slightly different one. Nobody can reproduce it, challenge it, or improve it.
As above, the real costs are the review the code demands, the decisions taken on unverified output, and the absence of a shared method. The moat was never the maths — it is your shared knowledge and the way your organisation works. A tool your whole team calls the same way gives your steering committee a number it can reproduce, challenge, and calibrate over time. Every output above came from a seeded, versioned, open-source run — you can re-execute all of it today and get byte-identical results.
Try It on Your Own Programme
claude mcp add pmo-logic -- uvx pmorun-mcpThen ask Claude the question your next steering committee will ask you. The source is MIT-licensed at github.com/lemur47/logic; the technical docs cover setup in detail.